Using the Dashboard
The Jet dashboard provides information about the location and status of endpoints, the status of jobs, and the rate and volume of transfers. The dashboard reflects updated information when the page is refreshed.
Map Panel
The dashboard map displays the geographical location of endpoints, based on their external IP addresses. Select an endpoint to display its name, version and status.
- A green endpoint indicates that the server is available to Signiant cloud services
- A red endpoint indicates that the server is unavailable
If multiple endpoints are located in a close geographical area, they are grouped to indicate the number of endpoints in that location.
Note: A red endpoint group indicates that one or more endpoints in that area is in error.
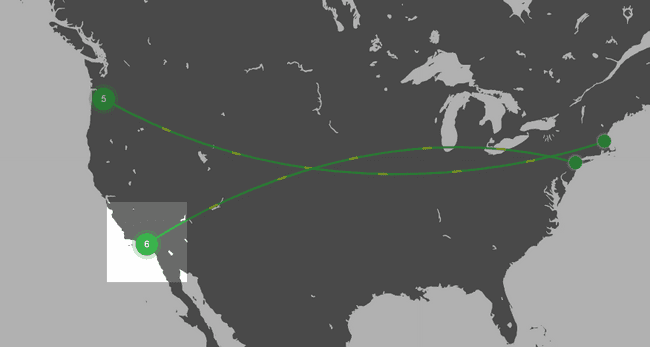
Selecting an endpoint group expands it to show the individual endpoints in that area.
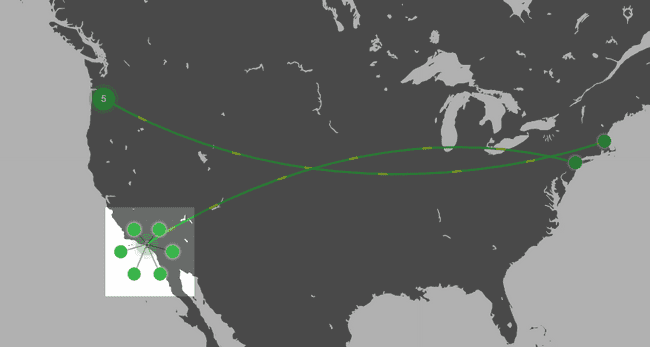
Clicking away from the expanded endpoints collapses them back into a numbered group.
To zoom in or out on an area of the map, use the zoom and move tools. You can also zoom by scrolling up or down over an area of the map.
Job Status Panel
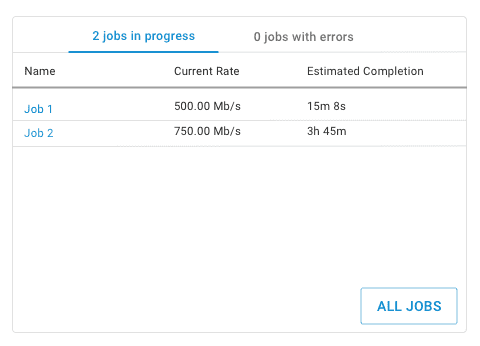
The Job Status panel lists jobs in progress and any jobs with errors. For jobs in progress, the panel displays the current transfer rate and estimated time to completion. For jobs in error, hovering over the warning icon reveals additional information. A job may appear on both lists if it is in progress but one or more files has failed to transfer.
Clicking a job name in the list takes you to the Job Details page. Clicking the All Jobs button directs you to the Jobs page.
Average Transfer Rate Panel
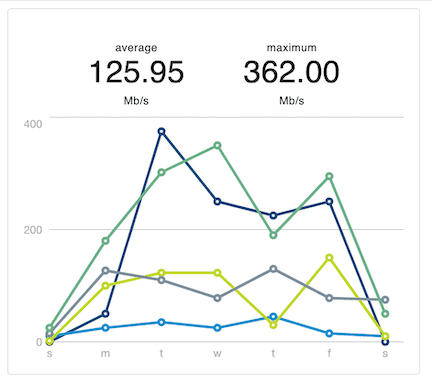
The Average Transfer Rate panel displays a chart of the average transfer rate of the five most recently active routes per day during the previous seven days. The panel also shows the average and maximum transfer rates of all transfers over the same period. Hovering over a specific day on the transfer rate chart reveals detailed information for that route.
Transfer Volume Panel
The Transfer Volume panel shows the total volume of files successfully transferred per day for the past seven days, and projected transfer volume for the next day based on transfer history. Hovering over a specific day on the transfer volume chart reveals detailed information for that day.
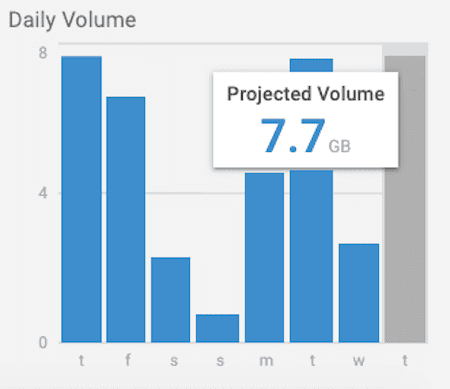
Note: Transfer Rate and Transfer Volume charts show days according to UTC time.